Conversions by Day
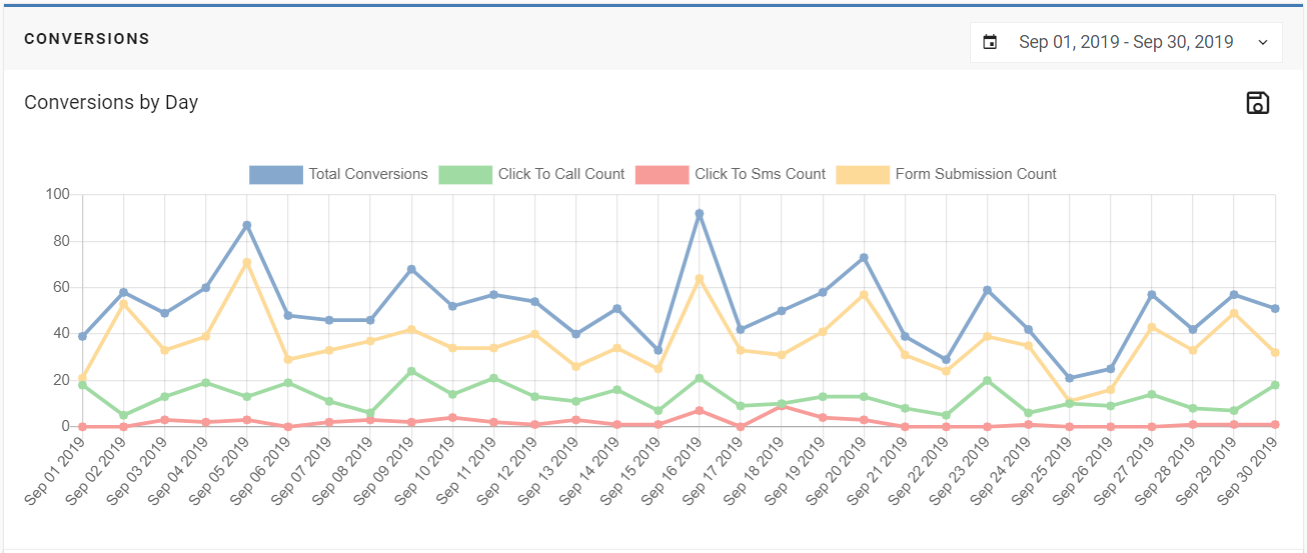
- The graph will display the following metrics: Total Conversions, Click to Call Count, Click To SMS Count, and Form Submission Count.
- The default display for the Drilldown is Conversions by Day.
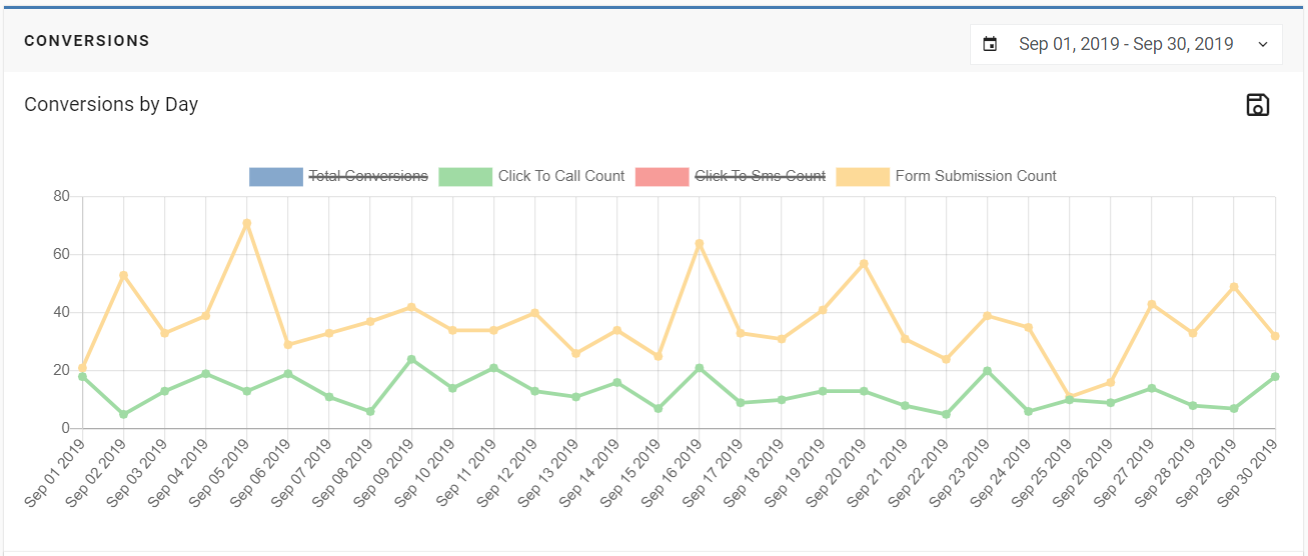
- To hide specific metrics, click on the name of the metric and the graph will remove that metric from the graph.
Conversion Details
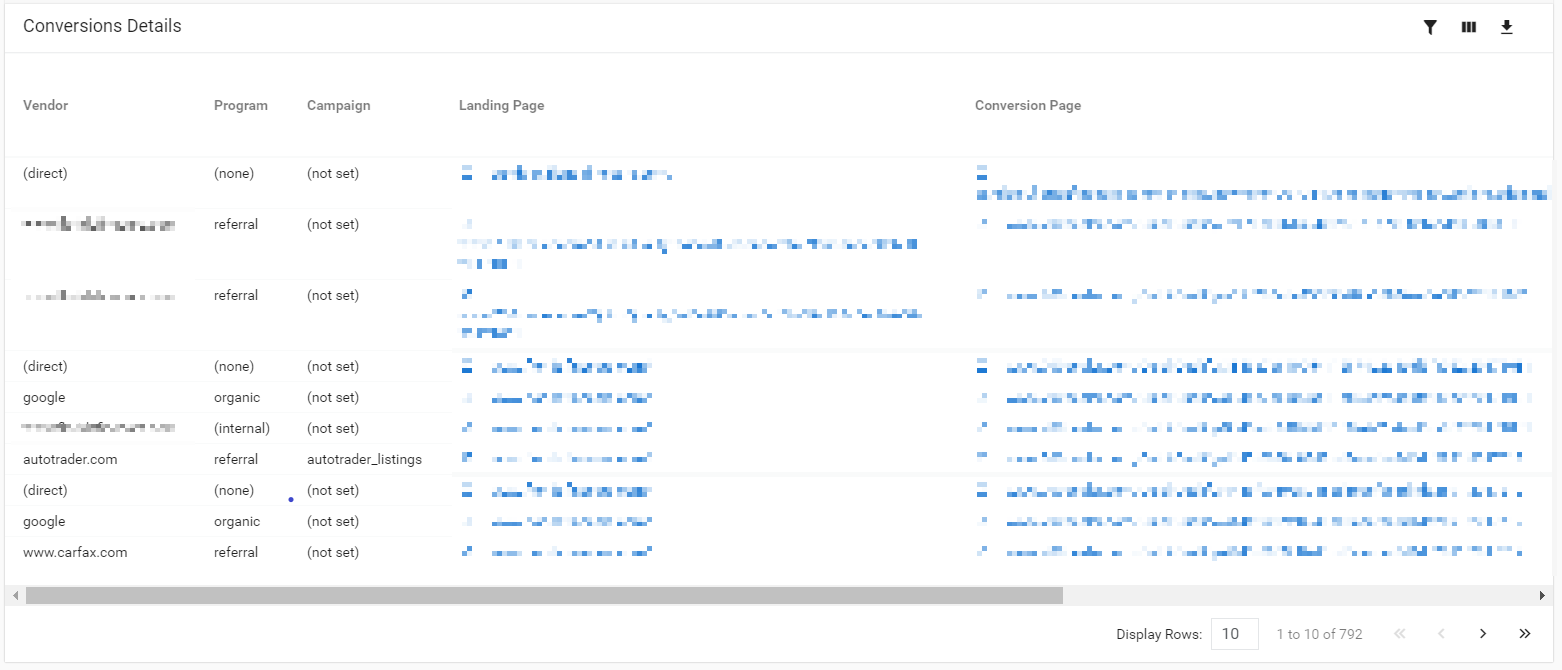
- For the Conversions Details table, it will display the Vendor, Program, Campaign, Landing Page, and Conversion Page.
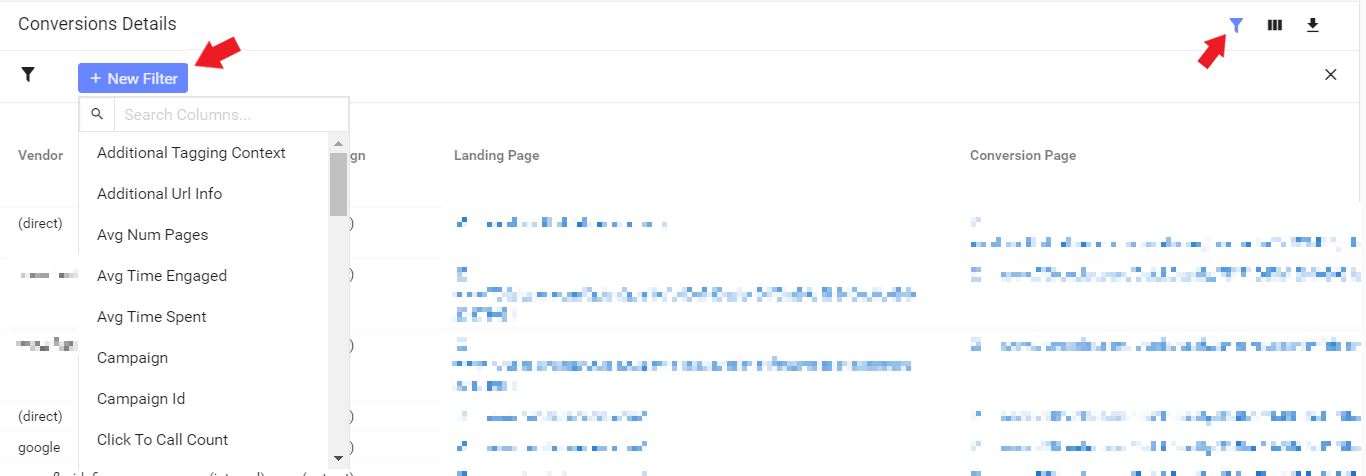
- You can filter the Conversions Details by clicking the funnel on the top right of the table and then clicking + New Filter and then selecting the filter(s).
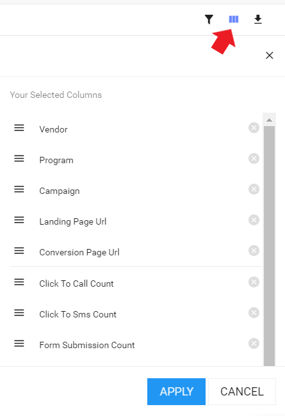
- You can change the column order by clicking on the three columns on the top right of the table.
- You can delete the column by pressing the "x." To change the order of the columns, you can drag the column up or down using your mouse.
- You can continue to customize your columns for the Conversions Details by selecting different Dimensions and Metrics.
- By clicking one of the arrows below (near the red arrows) you can check or uncheck several options for your column customization.
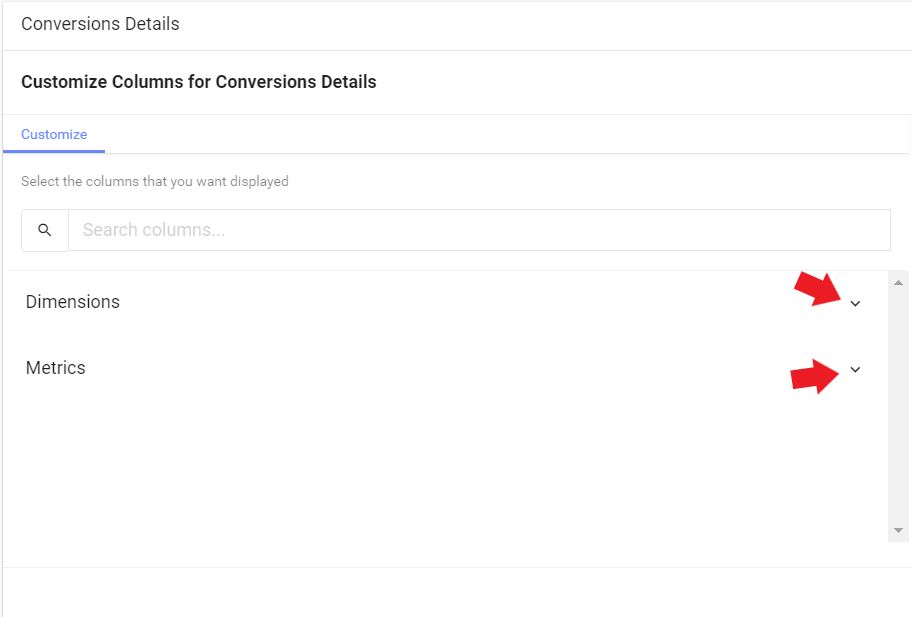
- You can also use the search bar to find a specific Dimension or Metric.
- When you are done making your changes, be sure to click Apply. You can also choose to press Cancel if you do not want to make any changes and return to the original settings.
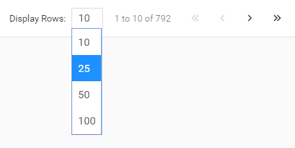
- To change the number of rows, click the drop-down menu near Display Rows and select your change.
- You can go one page forward or one page backward by pressing the > or < buttons.
- If you would like to go to the last page, click the >> button. If you would like to go to the first page, click the << button.
Last Updated: Dec 9, 2019 3:06 PM
To continue looking at the Orbee Platform, check out the Shoppers tab.