The Drilldown section will show you in-depth details about the metrics from your website.
Visits by Day
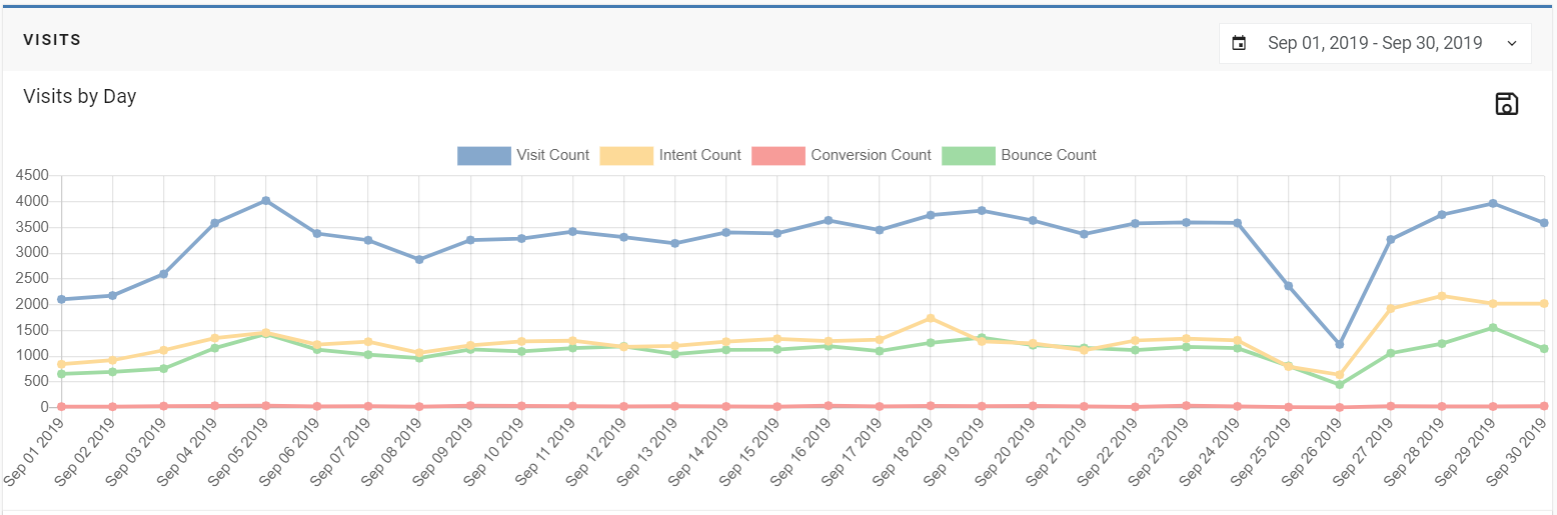
- The default view for the Drilldown page will show the Total Visits by day from the last month.
*Note: If you click Drilldown from a different page of the Platform, the data from that page will remain on the Drilldown section until you refresh your page.
- You could get to the Drilldown section by clicking on specific Campaigns from the Campaign Performance page or by clicking any number on the Source Medium page.
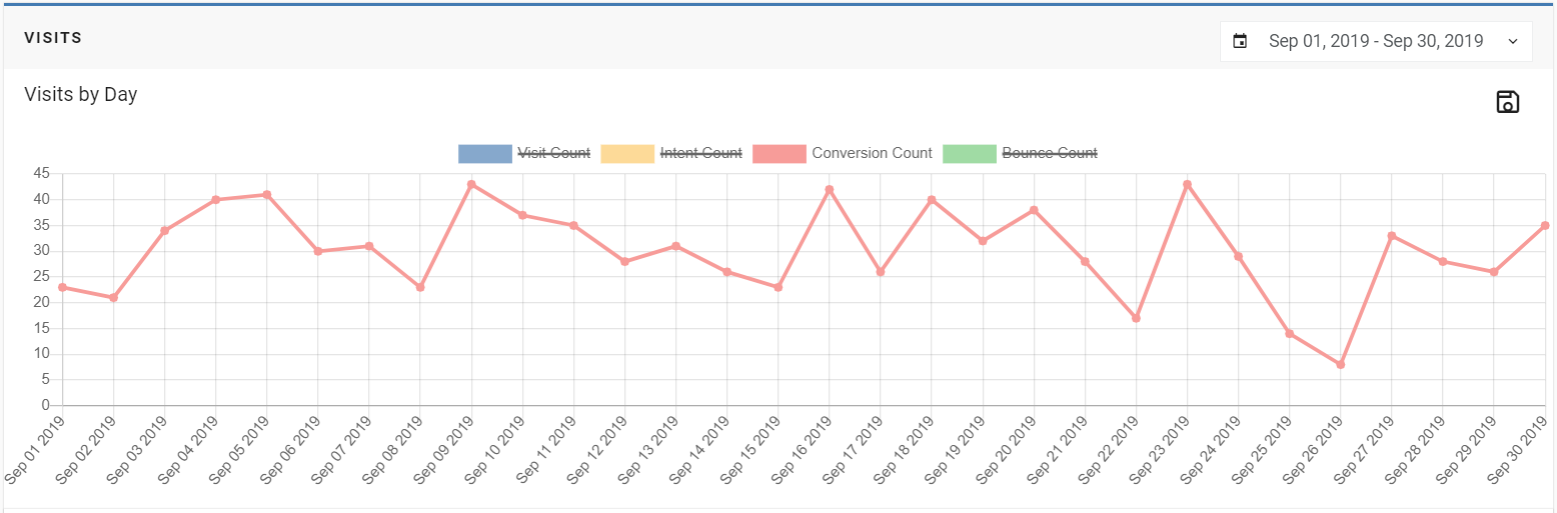
- Another important feature is the ability to remove metrics from the graph by clicking on the name (shown in the image below).
- The graph below only shows the Conversion Count. Typically, with all the metrics shown on the graph (like above) the points may not show clearly due to the numbers being too high for the other metrics.
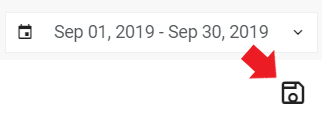
- To save the current graph you are viewing, you can click the save icon below the date range. This will save the graph onto your computer for offline purposes if needed.
Visits Drilldown Details
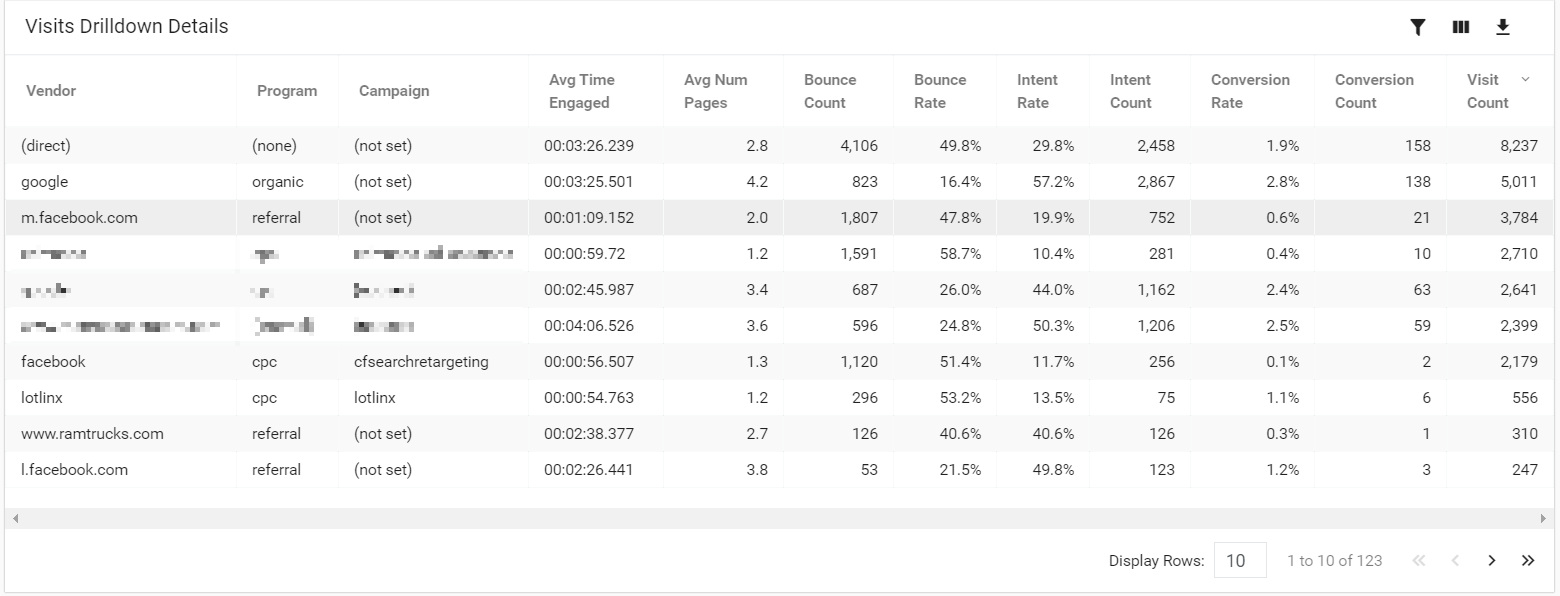
- Below the line graph, you will be able to see the Drilldown Details. The columns you see will depend on the last view you have seen.
- Below here are Vendor, Program, Campaign, Campaign, Avg. Time Engaged, Bounce Count, Bounce Rate, Intent Rate, Intent Count, Conversion Rate, Conversion Count, and Visit Count.
- You can click on a metric from the table to see an ascending or descending order of each vendor (source).
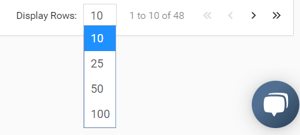
- To display more Drilldown Details, you will need to click the drop-down menu where Display Rows is located (bottom right of the screen) and select the number of rows you would like to display.
- You can also go to the next page by pressing the > or go back a page with <. To go to the end of your list, you can press the >> icon. To go back to the beginning, click the << icon.
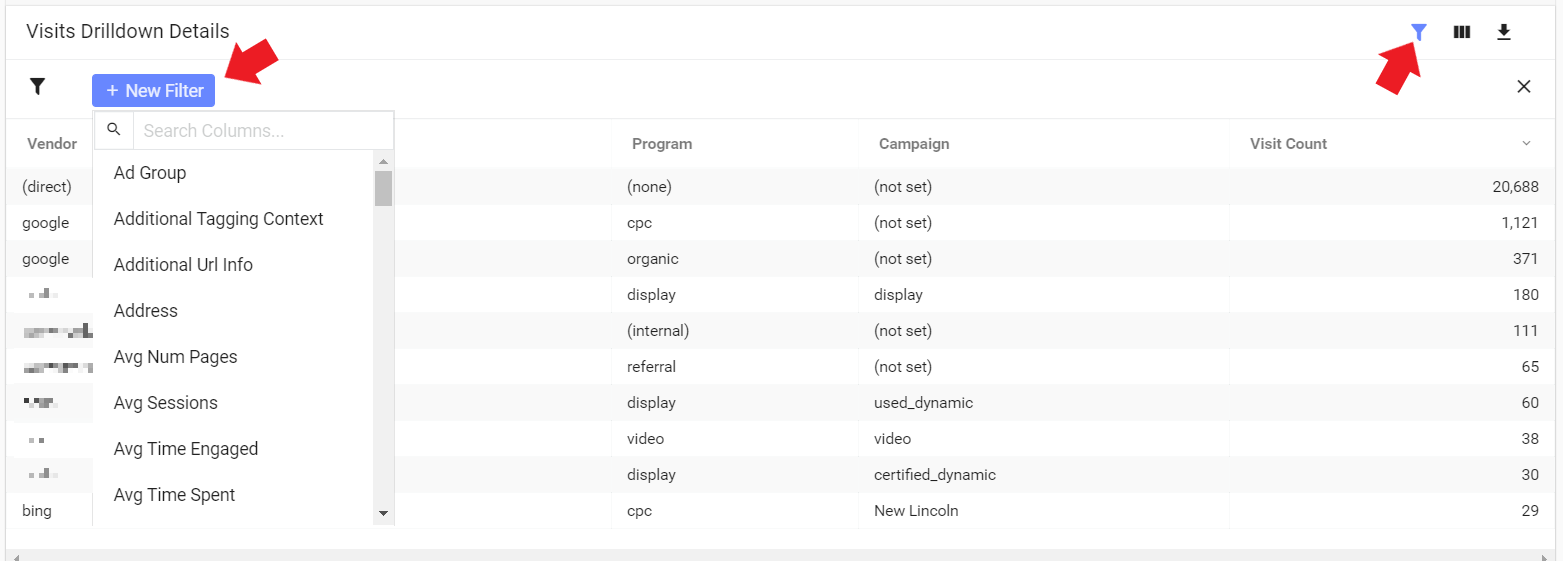
- To add a filter to your Drilldown details, you will first have to click the funnel icon at the top right of the table. Then, you press the + New Filter button on the top left side of the table. Select your filter(s) from the drop-down menu.
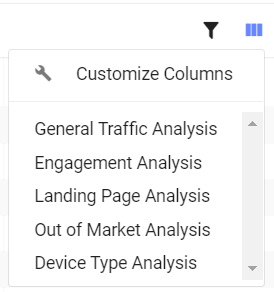
- You can also change the Drilldown Details by selecting the three-panel icon and selecting your option in the drop-down menu.
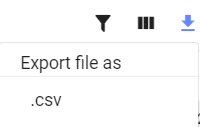
- To export the data table into a Microsoft Excel file, click the download icon and it should drop down a menu and you will click "Export file as .csv."
- You can learn more about this section by checking out how to make better use of the Drilldown.
Last Updated: Dec 9, 2019 2:39 PM
The last section under the Analyze tab will be Page Views.