Shoppers Overview takes a quick look at your shoppers' metrics.
General Shopper Analysis
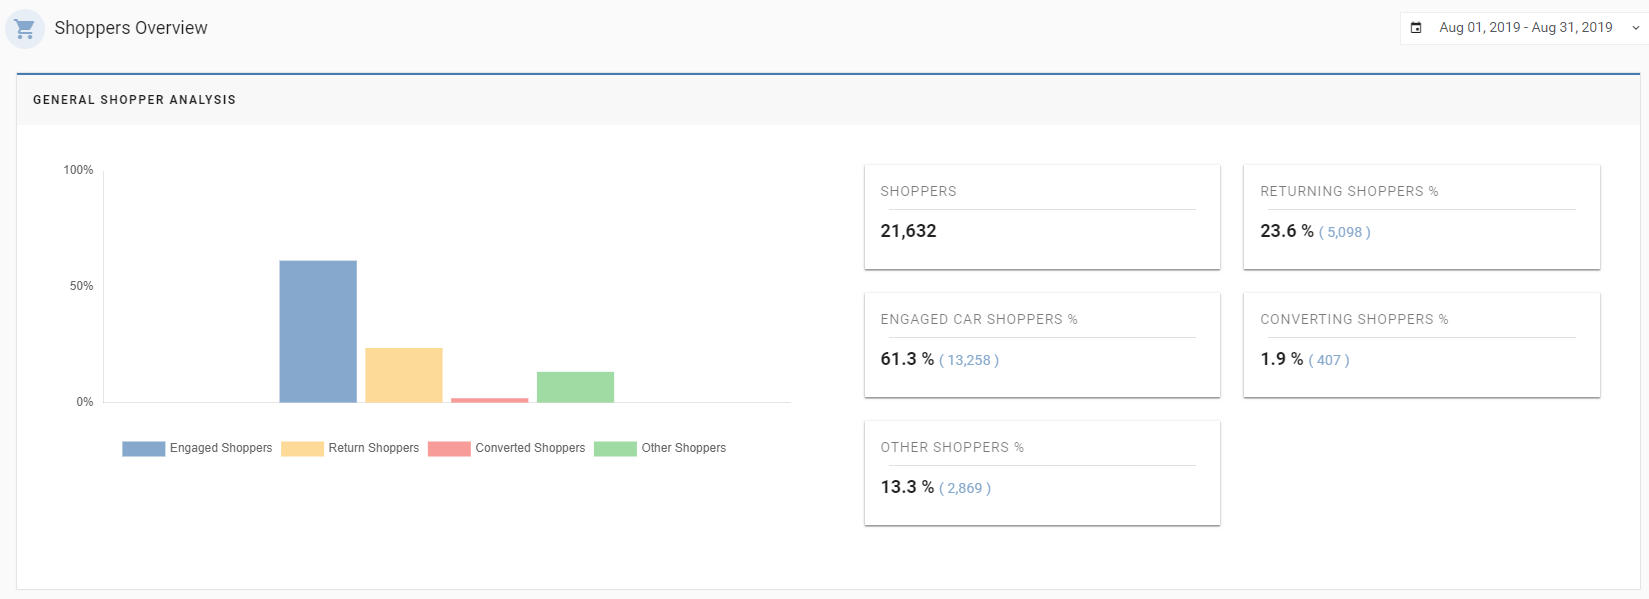
The first graph you will see is the General Shopper Analysis bar graph. The bar graph displays the Engaged Shoppers, Return Shoppers, Converted Shoppers, and Other Shoppers.
- The total number of Shoppers from the last month will be displayed on the right side along with the above-listed metrics.
- The other percentages will include Engaged Shoppers %, Return Shoppers %, Converted Shoppers %, and Other Shoppers %.
- You can also change the date range if needed.
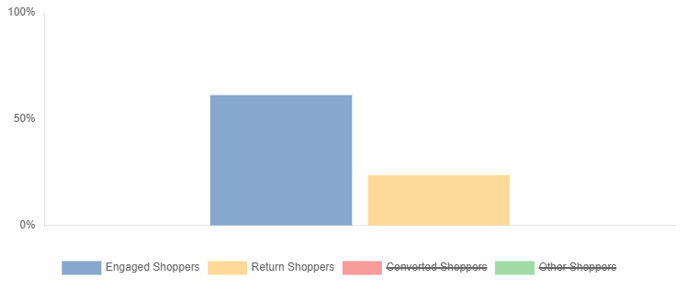
- You can also hide specific metrics by clicking on the name of the metric that is at the bottom of the graph. This will cross out the metric name and hide those metrics on the bar graph.
Car vs. Shopper Analysis
The other graph displayed in Shoppers Overview is the Car vs. Service Shopper Analysis section.
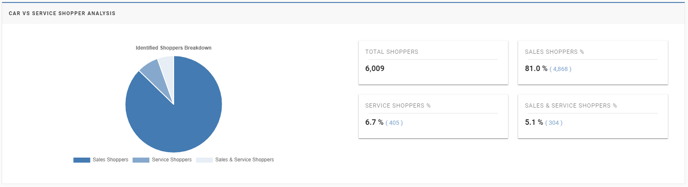
The pie graph displays the number of Sales Shoppers, Service Shoppers, and both Sales & Service Shoppers.
- The number of Total Shoppers, Sales Shoppers %, Service Shoppers %, and both Sales & Service Shoppers % are listed on the right side of the pie chart.
- This pie chart compares the three kinds of shoppers that may visit your website.
Car Shopper Analysis
The last graph that is under the Shoppers Overview section will be for the Car Shopper Analysis.
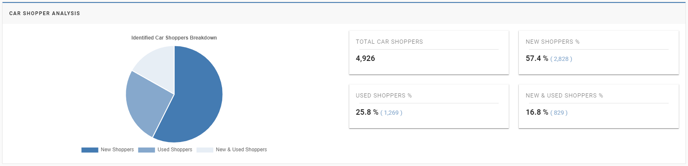
- For this section of the Shoppers Overview, you will be able to see what kind of car your shoppers are looking for.
- The metrics include Total Car Shoppers, New Shoppers, Used Shoppers, and New & Used Shoppers.
- Knowing and understanding your shoppers can help you decide which campaigns to push for your car dealership.
Last Updated: June 4, 2020 11:05 PM
To continue looking at your shoppers, check out New Car Shoppers Analysis.